Port Dashboard provides real-time monitoring tools for port users and stakeholders, plus supply chain performance metrics, maps and weather data.
Real-time monitors
Several real-time monitoring programs are in place throughout the Port of Vancouver to help keep users informed and enable better planning.
eHub app |
GPS dashboard |
Webcams |
Noise monitoring |
 |
|||
| Real-time supply chain status through the Port of Vancouver eHub app. | Container truck GPS data providing wait times at port terminals. | Live video feeds from around the port. | Noise data and information about our monitoring program. |
Supply chain performance
We provide reports and metrics to assist terminals and other supply chain participants to plan accordingly.
Rail metrics |
Trucking metrics |
Vessel metrics |
 |
||
| Includes container terminal rail performance. | Includes container truck performance update and container truck GPS data. | Includes container vessel on-time performance data. |
Connect+: optimizing supply chains through innovation and collaboration
The Vancouver Fraser Port Authority is partnering with industry and stakeholders to advance Connect+, a newly named program that consists of several collaborative initiatives focused on optimizing the planning and coordination of goods movement at the port of Vancouver.
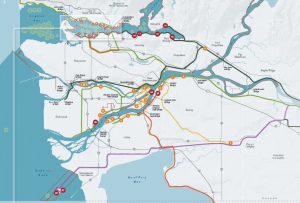
Maps
We have various maps covering our federal jurisdiction and terminals, habitat enhancement projects, land use designations, and coastal imaging and habitat mapping in port.
Port map |
Habitat enhancement |
Land use |
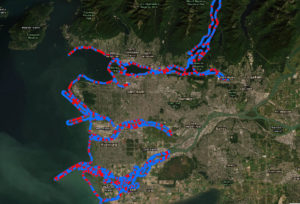
ShoreZone |
|
|
|
|
|
| Port authority’s jurisdiction and terminals | Habitat Enhancement project locations | Land use designations as per the Land Use Plan | Coastal imaging and habitat mapping system |
Current third-party weather information and tide predictions. Learn more about weather and tide.